


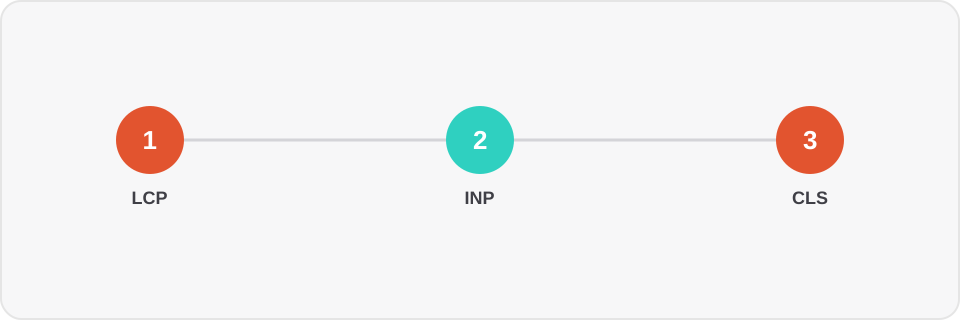
Core Web Vitals are the three metrics Google (and, to a large extent, Yandex) uses to measure real-world page-load user experience. This isn't a synthetic audit score — it's aggregated data from real visitors' browsers. Let's go through each metric and the concrete steps that affect it.
LCP — Largest Contentful Paint
LCP measures how many seconds after the page starts loading the largest visible element renders — usually a hero image, a headline, or a text block. The target is under 2.5 seconds.
What most commonly breaks LCP:
- a hero image without
priority/preload — the browser discovers it too late, only after parsing the rest of the CSS/JS; - fonts blocking text rendering (no
font-display: swapor font preloading); - a slow server response (TTFB) — if the server takes 800ms to respond, LCP physically cannot fit under 2.5 seconds.
The practical fix: explicitly mark the above-the-fold image for priority loading (in Next.js, the priority attribute on next/image), and for fonts, use font-display: swap plus preloading for critical weights.
INP — Interaction to Next Paint
INP replaced the older FID metric and measures interface responsiveness across an entire visit, not just the first click. The target is under 200ms. The metric captures the slowest significant interaction: a button click, opening a menu, typing into a field.
The main cause of poor INP is heavy JavaScript blocking the main thread during interaction. Fixes:
- break long tasks into smaller chunks (code splitting, lazy-loading non-critical components);
- avoid synchronous, heavy computation inside click handlers — move it to
requestIdleCallbackor debounce it; - reduce third-party JS — chat widgets, analytics, and tracking pixels often contribute more to INP than the rest of the site combined.
CLS — Cumulative Layout Shift
CLS measures how much the layout "jumps" during load — for example, when text shifts down after an ad or an image without set dimensions finishes loading. The target is under 0.1.
It's almost always solved the same way: explicitly reserve space for elements that appear asynchronously — set width/height (or aspect-ratio) on images and video ahead of time rather than after loading, and reserve height for banners and widgets before they actually load in.
How to measure it correctly
Lab tools (Lighthouse, PageSpeed Insights in simulated mode) give a reproducible but not always representative result. For the real picture, look at field data — the Core Web Vitals report in Google Search Console or the CrUX dashboard, which aggregates real visitor data over 28 days. Those numbers are what affect rankings, not a one-off measurement on a single device.
Bottom line
Core Web Vitals aren't a one-off optimization pass — they're a consequence of architectural decisions: how fonts and images load, how much third-party JS is loaded, how fast the server responds to the first request. If you'd like a concrete list of technical fixes for your site — order a performance audit.